Cases

A selection of projects I'm proud of. Details are anonymized for confidentiality.

Print & Packaging multinational

S&OP process at international printer

Designed and implemented a full Sales & Operations Planning process connecting demand, supply and finance. From spreadsheet chaos to monthly consensus meetings with a shared dashboard.

Result: Forecast accuracy +30%, inventory reduction 15%
Manufacturing multinational

Workforce planning production sites

Built a workforce planning system managing 8 production sites and 500+ employees. Started in Excel, later migrated to a robust database solution with Power BI reporting.

Result: Planning efficiency +25%, overtime -20%
Energy provider

KPI dashboard energy sector

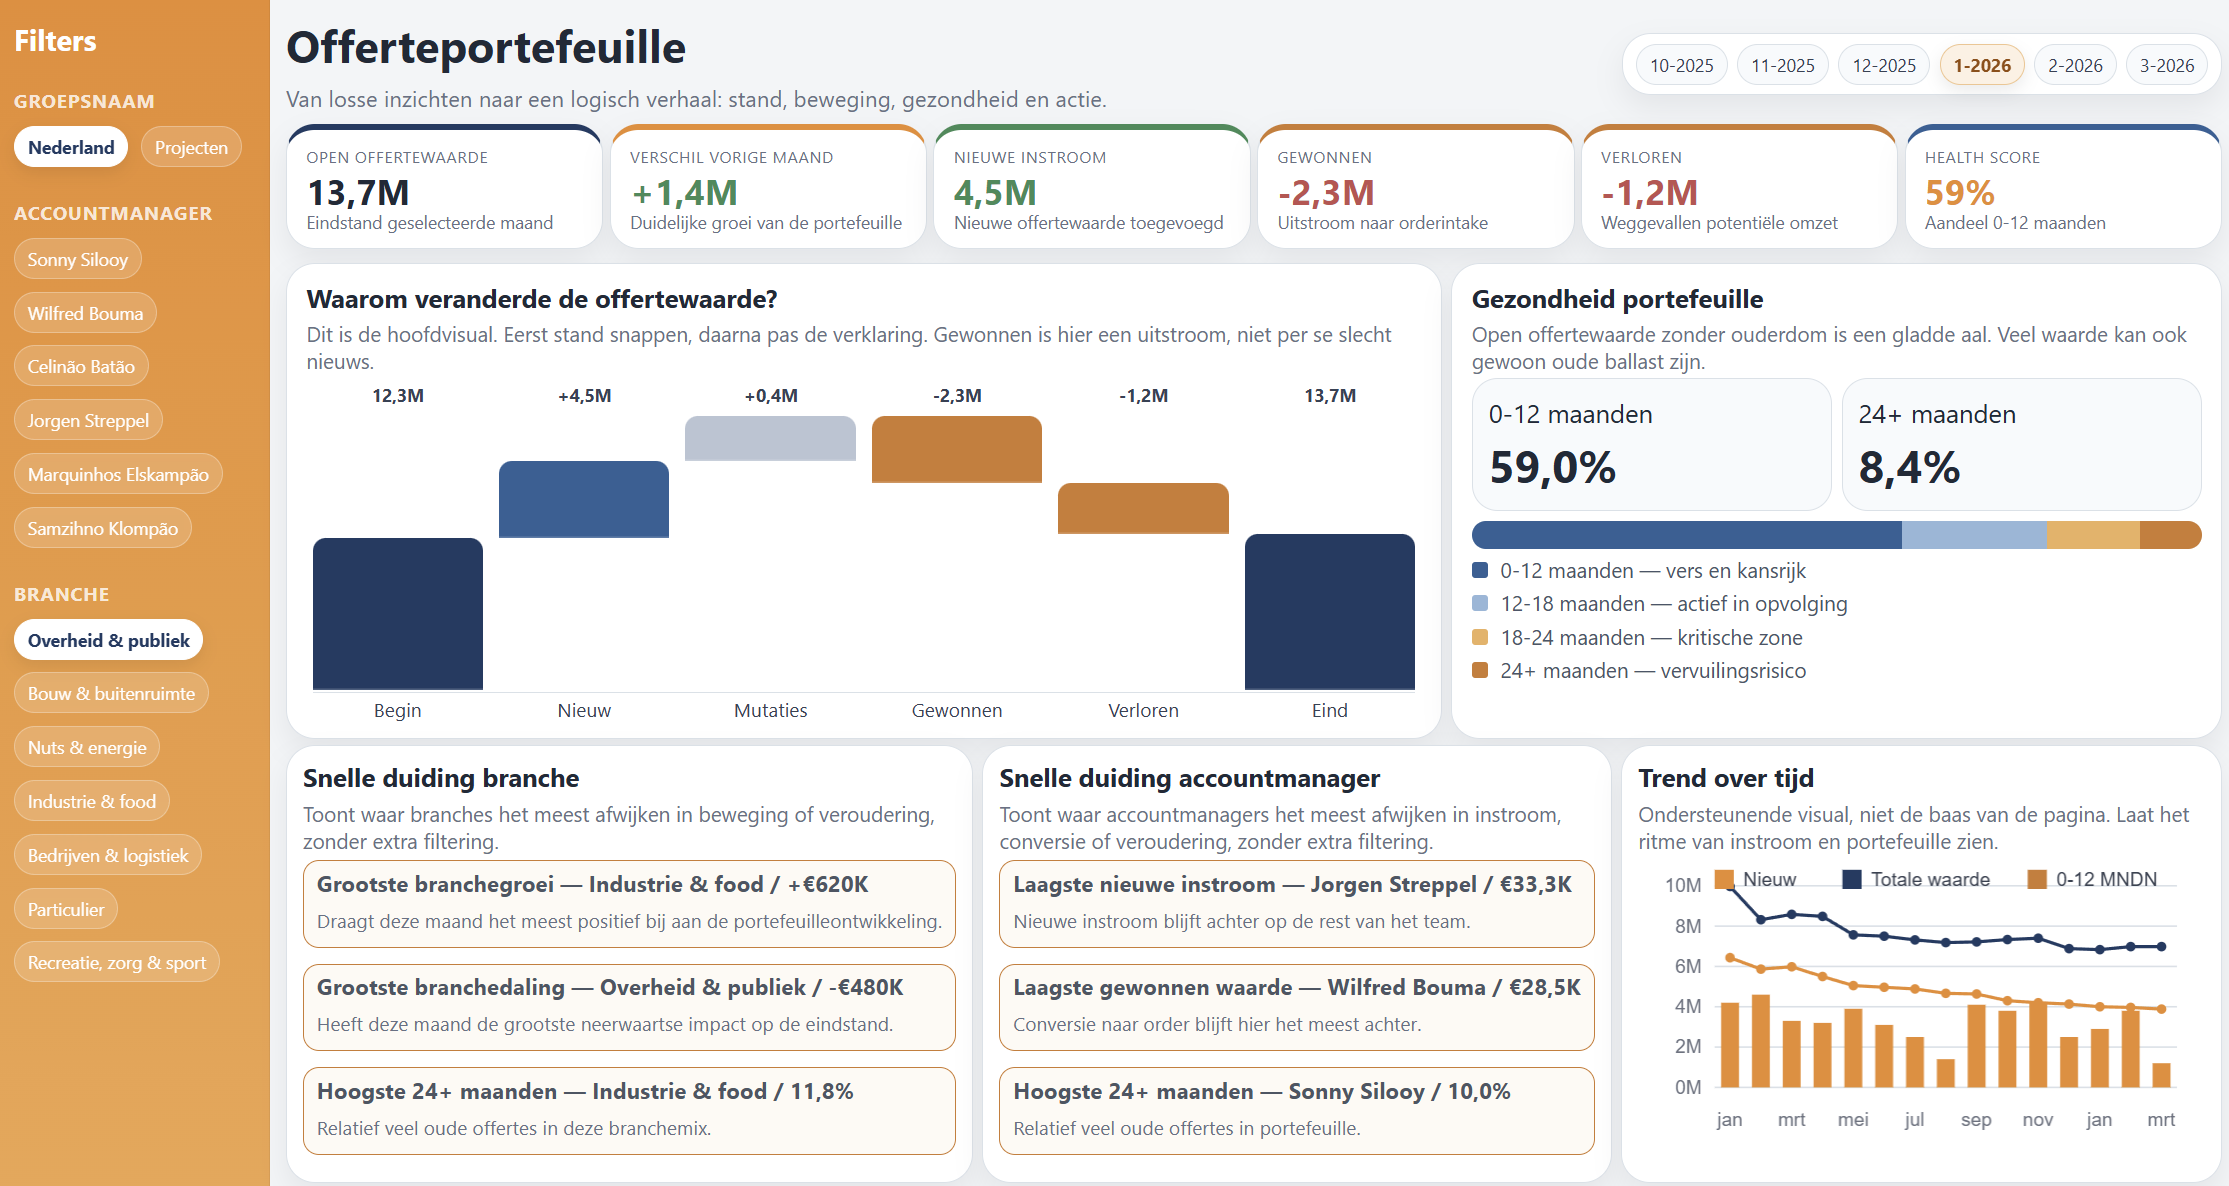
Built an organization-wide KPI dashboard in Power BI combining operational, financial and customer satisfaction data. Replaced 12 separate Excel reports.

Result: 12 reports → 1 dashboard, reporting time -80%

What clients say

Sonny Silooy — B&G Hekwerk
Client
Why do we use Power BI?

Because your accountant tells you what already happened.
While as an entrepreneur, you're focused on what's coming next.

New orders. Future capacity. Looking ahead instead of explaining in hindsight.

The real question isn't:
"How did we do?"
but:
"Are we ready for what's coming?"

👉 What does my order portfolio look like over 3–6 months?
👉 Where are the risks (aging, low conversion)?
👉 Where should I adjust now?

For a client I built this dashboard that delivers exactly that insight:
from status → movement → health → action.

Not a report after the fact, but a steering instrument for the future.
B&G Hekwerk — Order Portfolio Dashboard
Peter Heijnen receives Startup of the Quarter award
In the media

Startup of the quarter Q3 2022

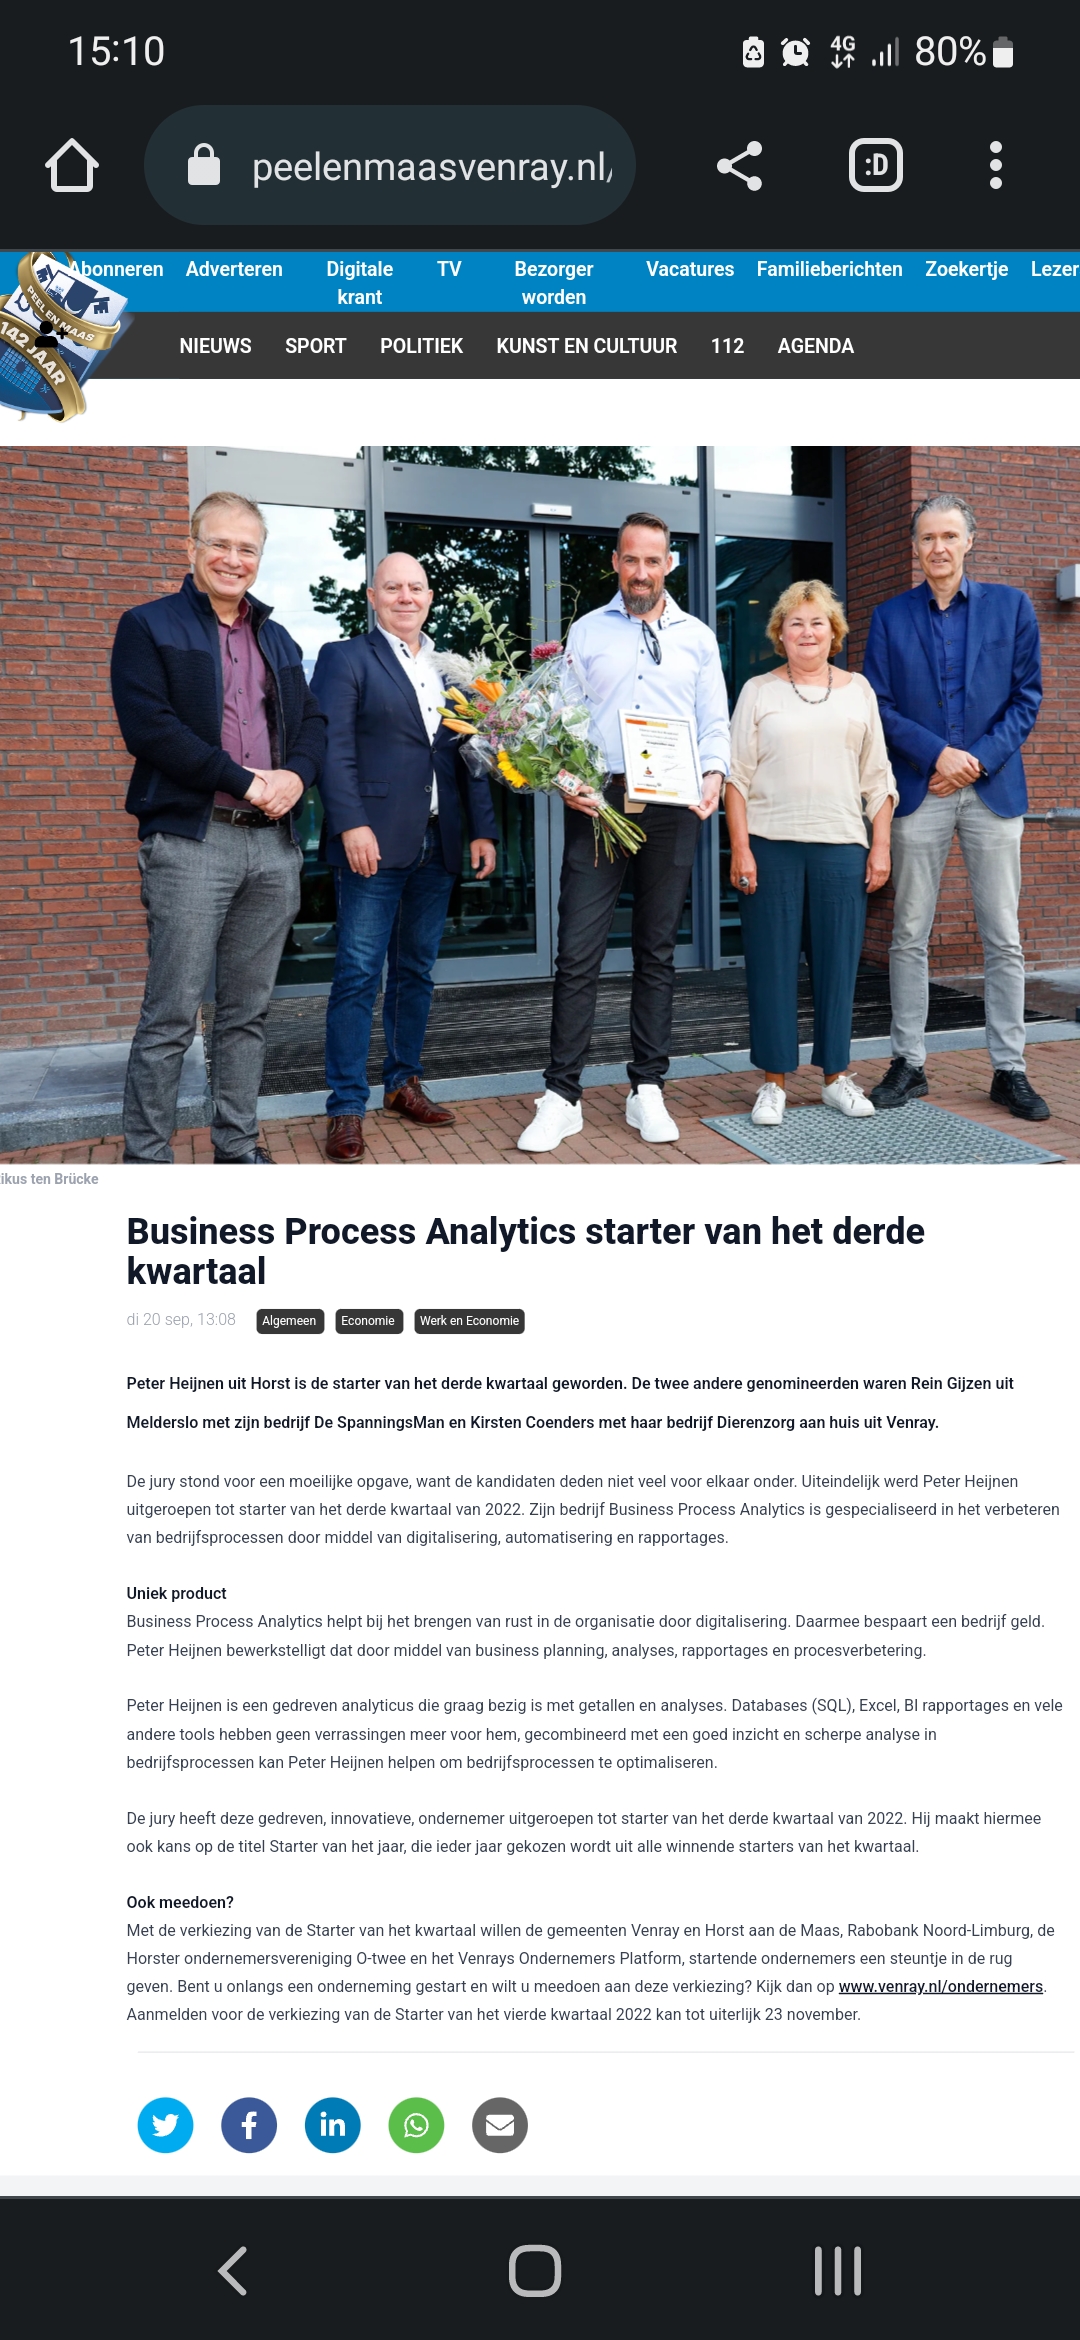
BPA was named Startup of the Quarter Q3 2022 by the municipality of Horst aan de Maas and Starterscentrum Limburg.

Get in touch